 Rocket Ads
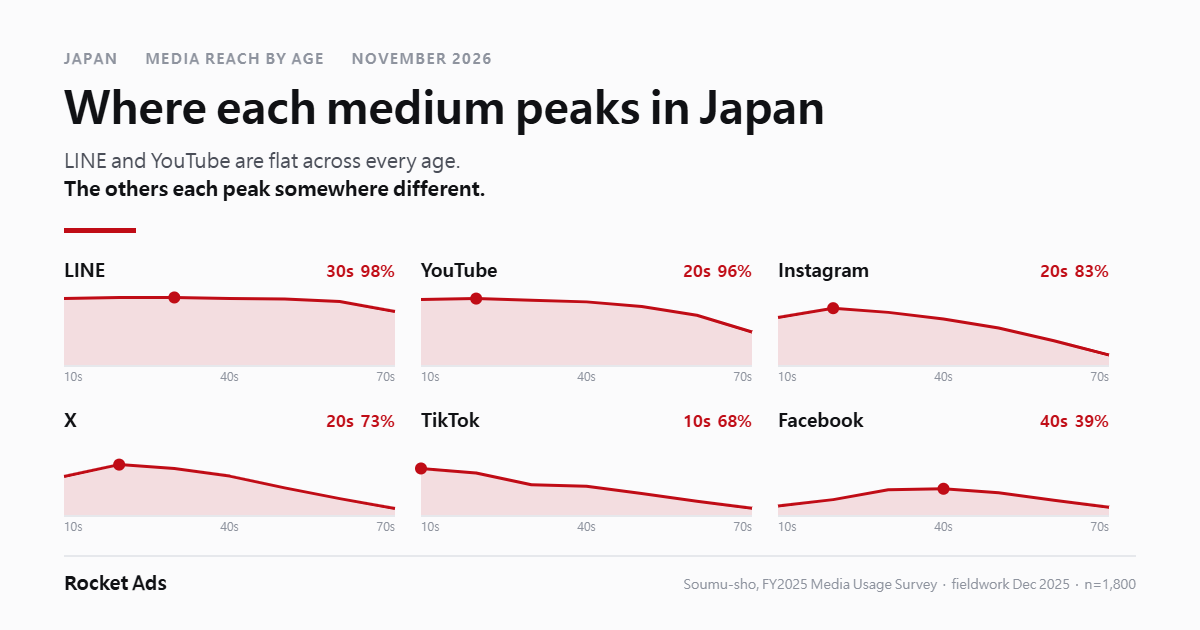
Which social and video services actually reach each age group in Japan? Only two reach all of them. In a survey of 1,800 people nationwide conducted in December 2025, LINE and YouTube held up across all seven age bands, and everything below those two changes order depending on the age you are trying to reach (MIC, 2026). The third-ranked service for people in their twenties is Instagram at 82.6%; for people in their sixties it is on-demand video streaming at 44.5%. X runs from 73.4% among twenty-somethings down to 24.8% among sixty-somethings, while Facebook moves the other way, from 14.3% among teenagers up to 38.9% among forty-somethings.
| Data: Japan’s Ministry of Internal Affairs and Communications, Institute for Information and Communications Policy, FY2025 Survey on Media Usage Time and Information Behaviour, published June 2026. Fieldwork 1–7 December 2025. Nationwide sample of 1,800 people aged 13 to 79, quota-allocated by sex and ten-year age band in proportion to the resident register, drawn by random location quota sampling across 125 points, surveyed by household placement with a diary and a questionnaire. Age-band samples: teens 140, twenties 218, thirties 235, forties 298, fifties 338, sixties 274, seventies 297. Figures are usage rates, not time spent and not advertising reach. The social table and the video table come from different questions in the same survey and should not be merged into one ranking. |
Which services reach every age group?
| Service | All | 10s | 20s | 30s | 40s | 50s | 60s | 70s |
|---|---|---|---|---|---|---|---|---|
| LINE | 92.9 | 96.4 | 97.7 | 97.9 | 96.6 | 95.6 | 92.0 | 77.8 |
| YouTube | 81.5 | 95.0 | 96.3 | 94.0 | 91.6 | 84.9 | 72.6 | 48.5 |
| 54.8 | 69.3 | 82.6 | 76.6 | 67.1 | 54.4 | 36.1 | 15.8 | |
| X | 44.7 | 56.4 | 73.4 | 67.7 | 57.0 | 40.2 | 24.8 | 10.8 |
| TikTok | 36.7 | 67.9 | 61.5 | 44.7 | 42.6 | 32.2 | 21.2 | 11.1 |
| 27.0 | 14.3 | 23.4 | 37.4 | 38.9 | 33.1 | 22.6 | 12.5 | |
| Niconico | 12.1 | 19.3 | 22.9 | 20.0 | 13.1 | 5.9 | 7.3 | 4.7 |
Usage rate, %. Red marks each service’s highest age band. MIC, 2026. All ages n=1,800. “Main social media services and apps” question.
Two services have a high floor. LINE never drops below 77.8%, and YouTube never drops below 48.5%. The other five each build to a peak and fall away on both sides. An all-ages average hides that shape entirely: Instagram and X sit ten points apart overall, but among twenty-somethings the gap narrows to nine points and among sixty-somethings it widens again to eleven.
What reaches teens and twenties?
Below LINE and YouTube, every remaining service clears 50% in this range. Instagram runs 69.3% among teens and 82.6% among twenty-somethings, TikTok 67.9% and 61.5%, X 56.4% and 73.4%. Whichever one you pick, you reach more than half the band.
The two bands are not interchangeable, though. TikTok is at its highest among teenagers and is already falling by the twenties. Instagram and X do the opposite and peak in the twenties. Treating the two bands as one group makes that choice invisible.
What changes in the thirties and forties?
The order changes here. For people in their thirties it runs LINE 97.9%, YouTube 94.0%, Instagram 76.6%, X 67.7%, TikTok 44.7%, Facebook 37.4%. By the forties, Facebook at 38.9% has nearly caught TikTok at 42.6%. Of the seven services measured, Facebook is the only one used more by middle-aged respondents than by younger ones.
The video side moves the same way. Catch-up broadcast streaming, the category TVer sits in, peaks at 51.5% among thirty-somethings and 50.7% among forty-somethings, about fifteen points above teenagers. Subscription video on demand does the reverse and peaks at 80.7% in the twenties. Folding both into a single “OTT” line cancels those two directions out.
What still reaches fifties and sixties?
Among fifty-somethings, LINE at 95.6% is the only service above 90%. YouTube falls to 84.9%, and Instagram, X, Facebook and TikTok bunch together between 32% and 55%. By the sixties, LINE holds 92.0% and YouTube 72.6%, Instagram sits at 36.1%, and everything else is under 25%.
Adding services stops buying much reach in this range. On the video side, subscription video at 44.5% and catch-up broadcast at 41.6% hold up at roughly the same level as Instagram.
What reaches people in their seventies?
LINE reaches 77.8% and YouTube 48.5%. Everything else is below 25%. Within video, catch-up broadcast streaming at 23.6% is higher than subscription video at 17.8%, the only age band where that is true.
Is video one channel or three?
| Category | All | 10s | 20s | 30s | 40s | 50s | 60s | 70s |
|---|---|---|---|---|---|---|---|---|
| Video sharing, on demand YouTube and similar | 84.7 | 95.7 | 97.7 | 97.0 | 93.3 | 90.2 | 76.6 | 52.5 |
| Subscription video on demand Netflix and similar | 56.6 | 69.3 | 80.7 | 80.0 | 69.1 | 52.4 | 44.5 | 17.8 |
| Catch-up broadcast streaming TVer and similar | 43.1 | 35.7 | 46.8 | 51.5 | 50.7 | 49.7 | 41.6 | 23.6 |
| Live streaming | 6.6 | 11.4 | 13.8 | 13.6 | 5.7 | 3.6 | 1.8 | 2.4 |
Usage rate, %. MIC, 2026. “Video sharing and streaming services” question — a different question from the table above.
Does gender split a service more than age does?
| Service | Men | Women | Gap |
|---|---|---|---|
| 46.2 | 63.4 | 17.2 | |
| TikTok | 31.8 | 41.7 | 9.9 |
| YouTube | 84.4 | 78.6 | −5.8 |
| LINE | 91.7 | 94.1 | 2.4 |
| X | 44.7 | 44.7 | 0.0 |
Usage rate, %. MIC, 2026. Men n=900, women n=900.
Instagram shows a 17-point gender gap, the widest in the set. X is identical for men and women to one decimal place. Which variable matters more is not the same from one service to the next.
Where do Japanese users look for entertainment information?
The same survey asked which medium people use most to find information about hobbies and entertainment. The internet came first overall at 70.8%, and first in every age band from teens through sixties. Only the seventies named television (MIC, 2026).
For anyone marketing a game or an app, that is a favourable condition. The open question is which part of the internet, and the tables above are the answer.
How do you use this?
First, pick the age band before picking the medium. An all-ages figure averages twenty-somethings and sixty-somethings into one number. In this survey the widest spreads were Instagram, from 82.6% down to 15.8%, and X, from 73.4% down to 24.8%.
Second, do not treat teens and twenties as one group. TikTok peaks among teenagers; Instagram and X peak in the twenties.
Third, if your target is forty and over, keep Facebook on the list. It is the only one of the seven used more by that group than by younger people.
Fourth, do not treat video as one channel. Catch-up broadcast streaming peaks in the thirties and forties and is lowest among teenagers. Subscription video peaks in the twenties. The two run in opposite directions.
Fifth, if your target skews female, weight Instagram higher. Its gender gap is the widest in the set at 17 points.
What does this data not measure?
These are usage rates, the share of respondents who say they use a service. They are not time spent, and they are not advertising reach. A service with high usage and low attention is not the same buy as one with both.
The two tables come from different questions in the same survey, which is why YouTube appears at 81.5% in one and the video category it belongs to appears at 84.7% in the other. They should not be merged into one ranking.
Splitting 1,800 respondents across seven age bands leaves between 140 and 338 people per cell, with teenagers the smallest at 140. Read the bands as directions rather than precise points.
Launching in Japan or Korea? Rocket Ads by aix Inc. connects app publishers directly to Japan’s local reward media and helps them acquire high-value users. More data and insights are on rocket-a.com and our LinkedIn page. Contact Us